Case Study: Geospatial Data Visualization Demo Developed by Jamstack Consulting
Introduction
pgEdge, a pioneering technology company, is changing the landscape of distributed multi-region PostgreSQL database clusters. By serving customers in their local region on the edge they are lowering latency considerably. With this pgEdge is enhancing the efficiency and efficacy of databases. Their interactive, user-friendly product was developed in conjunction with JAMstack Consulting, a distinguished JavaScript agency known for their proficiency in data visualizations built with React.
Challenge
pgEdge aimed to develop an innovative geospatial data visualization tool with drag-and-drop capabilities, to supplement their groundbreaking database management solutions. They required a demo to present to potential investors, with the ambition of further developing it into a minimum viable product (MVP). The main challenge was merging sophisticated features like drag-and-drop data manipulation with user-friendly interface design in a complex system.
JAMstack Consulting's Role
pgEdge chose to collaborate with JAMstack Consulting, a leading JavaScript agency celebrated for their specialized skillset in data visualizations using React. JAMstack Consulting's track record in delivering data-driven, user-friendly, interactive interfaces strongly resonated with pgEdge's objectives.
Solution Development
JAMstack Consulting embarked on creating a bespoke solution tailored to pgEdge's specific needs. A cooperative approach was adopted to ensure the final product would align with pgEdge's vision.
Data Visualization
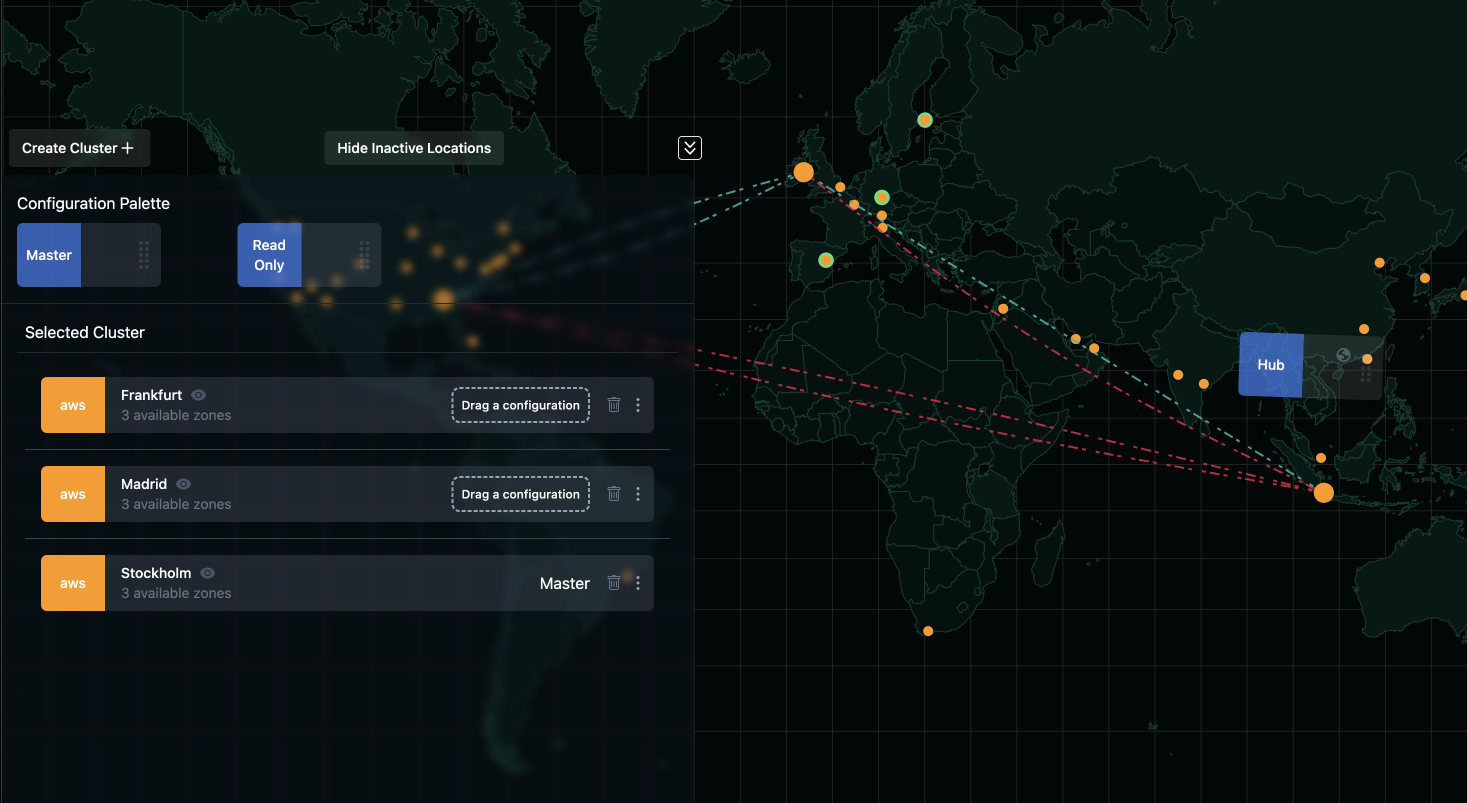
JAMstack Consulting leveraged the power of React's robust features for building interactive user interfaces to design the geospatial data visualization demo. They centered their design strategy around the simplification of intricate geographical data, making it easily understandable and accessible. Animated different colored lines were used to show node connections and latency. Nodes could be selected by clicking or dragging a configuration onto them. Every feature had a focus of allowing the user multiple intuitive ways to get the job done.

Drag-and-Drop Functionality
A key component of the product was the drag-and-drop feature, which JAMstack Consulting implemented using React's advanced state management via a library called Jotai. This allowed users to manipulate data effortlessly, offering a dynamic and immersive experience. A pallet of cluster types was provided allowing users to simply drop different configurations into the region they wanted.
Demo and MVP
The prototype was delivered as a geospatial data visualization demo, which was showcased to potential investors. The demo's compelling visuals, user experience, and ease of use were paramount. It was more than a static data presentation; it was a fully interactive tool with drag-and-drop functionality.
After a successful funding round, the demo was further refined and scaled into a Minimum Viable Product (MVP) for commercial deployment.
Results and Future Development
Following the demonstration, pgEdge successfully secured $9 million in funding. This underscored their innovative approach to lowering latency in distributed multi-region PostgreSQL database clusters. With the MVP, they successfully launched a product that is as beautiful as it is easy to use.
Looking ahead, pgEdge plans to utilize this funding to further enhance the product, expanding its features based on user feedback and market demands.
Conclusion
This case study demonstrates the importance of a strong vision, strategic partnerships, and the efficacy of cutting-edge JavaScript technologies in crafting revolutionary solutions. It highlights how a well-executed data visualization demo can lead to substantial funding and a triumphant product launch.